
Among our research, we found:
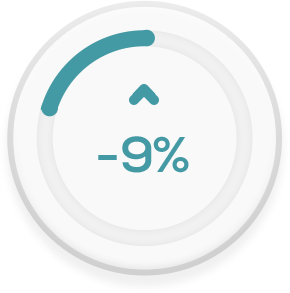
YoY Google Shopping CPC Reduction |
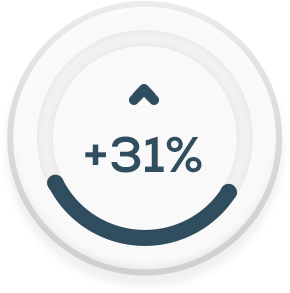
YoY Google Paid Search ROAS Growth |
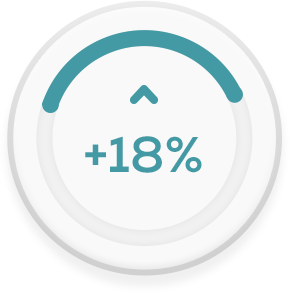
YoY Facebook AOV Growth |
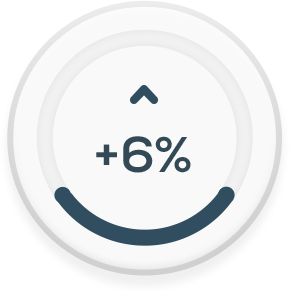
Average Amazon CVR in 2020 |
Several big players like Amazon and Walmart pulled back budgets on Google Shopping at the onset of the pandemic across many verticals. These retailers were focused on getting essential items to their customers. Many other retailers dropped their bids in the channel, contributing to lower CPCs. Retailers were still able to convert traffic efficiently in this new normal and grow conversion rates and ROAS in many verticals.
Google Shopping CPCs were lower year over year in the majority of examined verticals. This was likely the result of many retailers rethinking their spend in the channel during the pandemic. Increased search volume created higher demand for online products, which also helped lower CPCs.


Google sent waves through the retail industry when it announced limited visibility in its search terms report in September 2020. The company is also expected to ban third-party cookies beginning next year, so retailers will need to be even more flexible with their paid search campaigns.
One of the major ways Sidecar has adapted with its customers is by doubling down on audience segmentation strategies. These strategies can be a significant source of efficiency gains. Google paid search CPA was down in nearly every vertical year over year while CVR, CTR, and ROAS improved.


Advertising on social media is essential for retailers who not only want to grow in-store and online sales, but also develop brand loyalty with consumers. Facebook reported 1.85 billion active daily users in Q4 2020, emphasizing just how much reach retailers have on the social channel.
We took a deeper dive into the performance of five verticals on Facebook: apparel & accessories, automotive parts & accessories, house & home, mass merchant, and toys & hobbies. We then compared these verticals to the average performance across all verticals on Facebook to understand how different retailers responded to a unique 2020.


With a reported $13.86 billion in earnings in 2020, Instagram is one of the world’s largest e-commerce platforms. Instagram allows retailers to not only build their following in unique ways, but also leverage high engagement rates, as the data below shows.
While Instagram owned higher CPCs than Facebook, CVR was 23% higher on Instagram in 2020. When looking at performance by spend, retailers spending upwards of $25,000 monthly were best positioned for success. This group owned the lowest CPCs and CPA along with the highest CVR and ROAS.


We segmented our Amazon findings by single- vs. multi-brand performance, spend tiers, and monthly KPI performance for the full year of 2020.
Single-brand retailers had a higher CPC than multi-brand retailers. However, CVR for single-brand retailers was higher and CPA was lower compared to multi-brand retailers. This high engagement rate coupled with lower CPA could indicate stronger loyalty to single-brand retailers on Amazon.
Looking at monthly performance, note how stable CVR was throughout the year. As CPCs increased and click-through rate fluctuated, CVR stayed above 5% in all but one month of 2020. A strong Q4 CVR performance showed how confident consumers were spending during the year-end holiday season.


Quartile is the world’s largest retail media optimization platform. Leveraging six patented machine learning technologies, the platform offers automated and optimized advertising services for over 5,300 global brands and agencies. With more than $2 billion in annual ad spend under management, Quartile empowers brands and sellers to achieve unparalleled success through strategic insights cutting-edge AI-driven technology.

All Rights Reserved | Privacy Policy | Terms and Conditions